
IRR and NPV: Demystified
Below is a mathematical formula for calculating the Internal Rate of Return:
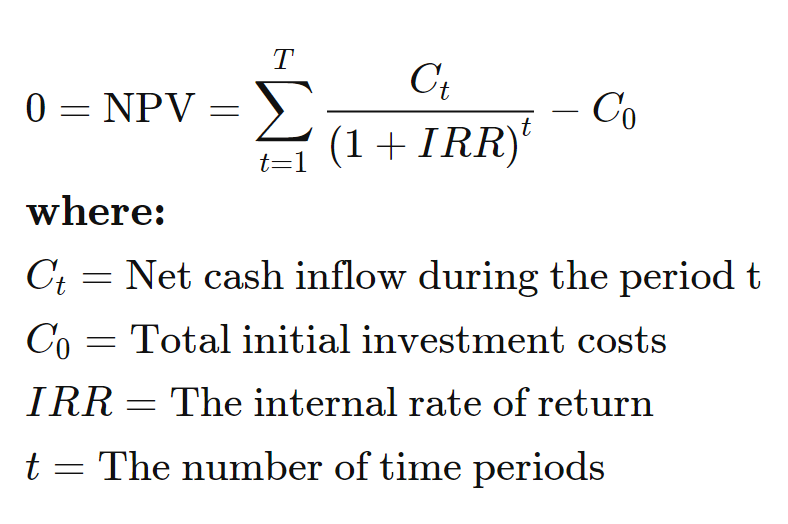
Much in the same way that “Fissure an oblong orb from a domestic fowl” is a long and complicated way of saying “Crack an egg,” the formula for IRR is a complicated way of writing a straightforward idea, the eventual annual rate of return for invested capital over a full investment cycle. Any commercial real estate investment company can help you with this.

There are a great number of resources available that explain the fine details of the Internal Rate of Return, one of which is the source for the above equation. This blog post will bring this knotty actuarial abstraction down to the ground level. As such, there may be some technical or mathematical nuances that are not included here, but this simplification is by design. Once you understand the basic purpose and operation of the Internal Rate of Return, it is easier to then go back and delve into more complicated ways to construct and utilize the metric.
The Internal Rate of Return is commonly used to project the profitability of an investment. Knowing this, and knowing that you cannot predict the future, you should be aware that the IRR is not a fixed absolute, and it is dependent on the information that you feed into it. You can use data from the past, change some inputs based on your plans for the property, and project a future IRR.
The IRR is measured over a specified period of time, the hold period. You can calculate the IRR based on your ideal investment window, with the period represented by the year. The IRR is a yearly rate, so the number you get will reflect the average growth for those seven years.
You could use any interval of time for the period when calculating the IRR. If you were modeling the IRR over a short hold period, say one year or even a month, you could use days or months for your period.
The Internal Rate of Return tries to answer this question: What is my actual annualized rate of return taking into consideration how much capital I invest compared to all the distributions/dividends I receive, and the return of and appreciation of my initial investment?

Net Present Value (NPV)

While we can’t predict the future, we can control for things that would skew our predictions. For one, a dollar today is worth more than a dollar a year from now. That’s one of the underlying assumptions used when calculating the IRR, and that assumption plays a large part in another term that can be used to help calculate the IRR, the Net Present Value (NPV).
Here is a simplified way to get the NPV:
- Start with the total capital outlay, and make that negative
- Calculate all future cash flows for each period by subtracting all of the cash flowing out from all of the cash flowing into the investment
- Cash flow includes distributions, capital calls, refinancing, and sales proceeds
- The cash flow for a given period can be negative in cases of renovations or other costly circumstances that affect your bottom line
- Include the price you’ll sell it for at the end of the period in question
- Adjust these prices by a discount rate to control for the different factors that lower the value of money in the future
- Interest rates
- Cost of debt
- Inflation
- Money that could have been earned in an alternative investment
- Add the (negative) purchase price to the adjusted values of each year’s cash flow and the final year’s sale price. The sum of these adjusted values is your NPV.
The adjustments and discount rate are key to thinking about the Net Present Value. This discount rate stands in for all of the factors that make money in the future less valuable than money at the present. You can adjust for what you would have made in an alternative investment. You can (and should) also adjust for the cost of debt, equity and taxes. All of these considerations can be part of the discount rate number, and it can vary based on what you choose to include. Commonly, the NPV is calculated with a discount rate based on the cost of capital called the Weighted Average Cost of Capital. Whatever you choose to include in your discount rate, you will end up with a percentage that represents the rate at which the value of a fixed amount of money will decrease in future years.
Here’s a quick example of how a discount rate works year to year.
If you make $100 from an investment every year, you need to adjust the future $100 income into today’s dollars. To do this, you multiply that future cash flow by 1 minus the discount rate to turn the first year’s dollars into current-value dollars. It gets trickier for the following years, so here’s a quick example:
Let’s look at three years of those $100 returns, and let’s put the discount rate at 10%.
Year one is easy enough to do in your head: 1 minus 10% is 90%. So the first year, you’ll get $90 in today’s dollars.
Year two? You need to square that 90%, which comes out to 81%. So you’ll get 81 dollars in today’s dollars.
Year three, you’ll cube that 90%, and you’ve got 72.9%. You’ll get $72.90 in today’s dollars.
Think about it: Your year three return could be $200, but in today’s dollars, it would be $145.8 in today’s dollars—just under two thirds of that amount.
To get the NPV for the investment, you need to account for the initial cost(s) of the investment, and you need to account for the final sale of the investment, which we illustrate below.
The IRR calculation comprises doing these steps to account for the value of your money in each year of the investment. Now that we have broken down what the discount rate and periods do each year, let’s combine this information and step through an entire sequence.
IRR and NPV in Action

Let’s say you have bought a $100,000 investment property. You are holding it for three years. Let’s make the discount rate 15% this time (so you’ll be multiplying by 85%). After three years, you’ll sell the property for $150,000. Year one returns will be $15,000, year two will be $10,000, and year three will be $18,000.
I’ll start with getting the discount for each year, so it’ll be .85 for the first year, (.85)² for the second year, and (.85)³ for the third year. Year one stays at .85, year two comes to .7225, and year three is .614125 for the adjusted discount.
Year one returns: $15,000 * .85 = $12,750
Year two returns: $10,000 * (.85)² = $7,225
Year three returns: $18,000 * (.85)³ = $11,054.25
So far, you project that you’ll make $31,029.25 on this property. But you bought it at $100,000, so you’re still in the hole to the tune of $68,970.75. Thankfully, you plan on selling the property for $150,000 at the end of year three.
Year three sale: $150,000 * (.85)³ = $92,118.75
From here, you just add up your adjusted returns and your adjusted sale price, then you subtract the purchase cost. You get $23,147.75. That’s the NPV, the Net Present Value of your investment at the end of the cycle.
How do you turn this into an IRR? Can you simply divide by the number of years, which in this case is three, and then divide by the initial investment, which is $100,000? Unfortunately, it’s a derivative, and it’s not that simple.
Formally, to get the IRR, you set the NPV to zero, and you solve for the rate. In the NPV calculation, the rate was 15%, but we’re going to set it to (and solve for) X in this case. We’re getting $23,147.75 when the rate is 15%, so we know that the rate has to be higher than 15%. But, because the effect of the rate changes each year, it is very difficult to figure out by hand outside of a trial-and-error process of plugging in different rates and finding out which one will make the NPV closest to zero. Fortunately, spreadsheets like Excel and Google Sheets have a built-in IRR function that will generate the value for you.
Like any financial metric, the IRR is just a tool. It can be used in different ways by different people, and, like the cap-rates we discuss in another blog post, an IRR means different things depending on the perspective of the investor, what their roles are, and what they are trying to do.
The most common use for the IRR metric is as a comparative metric used to weigh one investment versus another.
It’s also important to understand that a pro forma IRR can be manipulated in several different ways by adjusting the multiples variables and inputs. The most common way to manipulate an IRR to show outsized returns that may not be realistic is to change the value increase at the termination of an investment. Typically the largest tranche of cash flow is from the sale of an investment, and by assuming a frothy sales price an IRR can be higher than what might be conservative and realistic.
Want to stay on top of the latest real estate investment concepts, news, and reports? Follow the link below for our free weekly report.
[/et_pb_text][/et_pb_column] [/et_pb_row] [/et_pb_section]