The Reports Are In: Multifamily Performance in 2023
The most recent monthly reports from Apartment List, Yardi Matrix, and Redfin offer a valuable opportunity to assess the state of the multifamily market in a period of transition. Coming off of the deceleration in the latter half of 2022, the year-over-year rent growth numbers for the first few months of 2023 will be compared to a period in 2022 during which rent growth was at its peak. There are signs that the market is turning around from its slowdown, but it is still too soon to tell.
Before digging into the data from Yardi Matrix and Redfin, sharing a little more information from a few other sources will provide some additional context. There are a number of organizations that track rent growth, and these numbers can be vastly different, especially looking into the monthly numbers or market-by-market data.
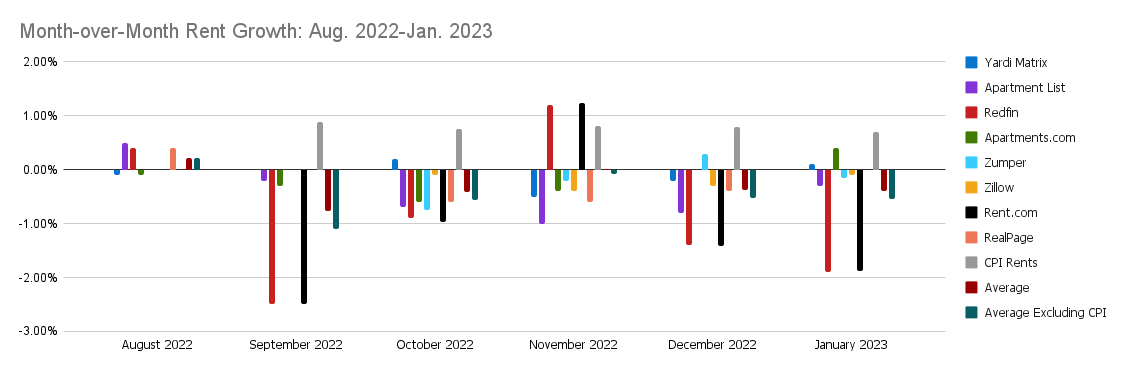
The volatility of some of this data is notable, but month-over-month rent data can jump around a little bit, even from one of the less-volatile sources. That being said, the black and red bars for Redfin and Rent.com (note: Redfin owns Rent.com but they have slightly different data) are the clear outliers. The other outlier, which will be more apparent looking at the year-over-year rent growth numbers, is the CPI, shown in gray in the graph above.
Eliminating Redfin and Rent.com, you could make a case that monthly rent growth is moving in a positive direction, and the numbers bear this out: If you exclude CPI, Redfin, and Rent.com, the average monthly rent growth was almost flat, -0.01%, which improved from -0.23% last month. For the full average, month-over-month rent growth was -0.39%, if you exclude CPI it was -0.55%, and again, if you exclude CPI and the Redfin/Rent.com outliers, it was -0.01%.
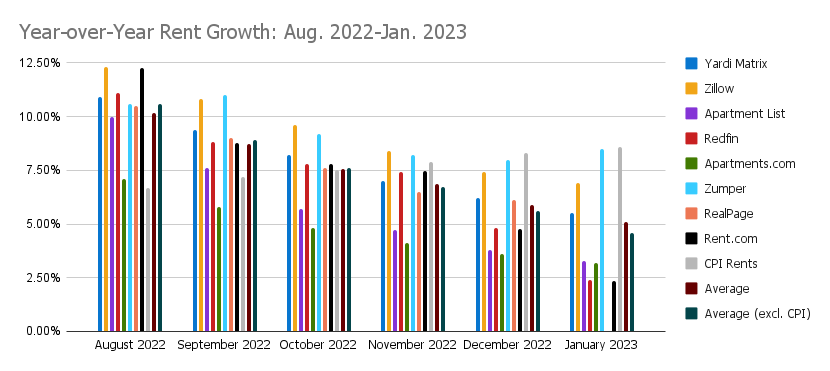
The year-over-year rent growth numbers, at a glance, show more variation than one might expect, but it is easy to see how CPI rent growth numbers are increasing while every single other rent growth tracker is showing declining rent growth. Zillow and Zumper stand out as sources still showing consistently higher rent growth, and the numbers from Apartments.com are, on the whole, the lowest in the series. No source has reported negative or even flat YoY rent growth, but we are coming up against the one-year anniversary of peak YoY rent growth, and that’s a tough comparison.
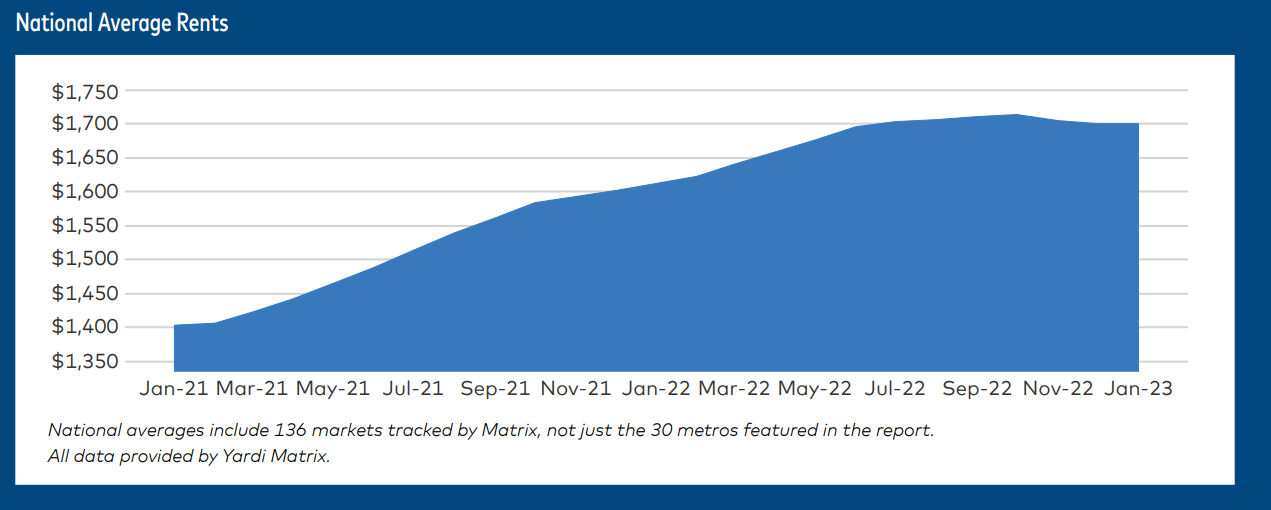
Starting with Yardi Matrix: They recorded 5.5% YoY rent growth and flat MoM rent growth in January, which is a slight improvement over the slight decline in December’s MoM rent growth numbers.
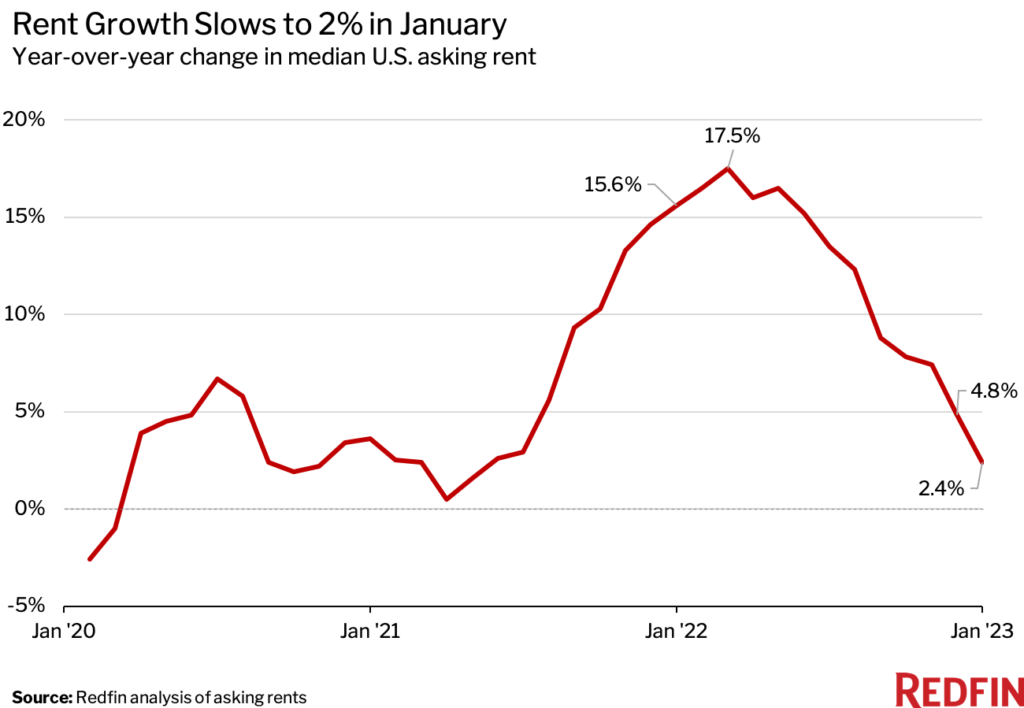
Redfin put YoY rent growth at only 2%, and their monthly rent growth, which they don’t list outright and I had to do math to calculate, the MoM rent growth is negative 1.9%. Redfin has big swings. Their peak YoY rent growth was 17.5% in early 2022. For comparison, the hottest Yardi Matrix rent growth numbers were 15.3% in February 2022.
Redfin’s top markets
Raleigh, NC: 22.5%
Cleveland, OH: 17.5%
Indianapolis: 14.9%
Charlotte: 14.2%
Nashville: 9.8%
Kansas City: 8.8%
Redfin’s worst performers
Phoenix: -6.7%
Oklahoma City: -6.3%
New Orleans: -5.2%
Minneapolis: -5.1%
Houston: -4.9%
Baltimore: -4.6%
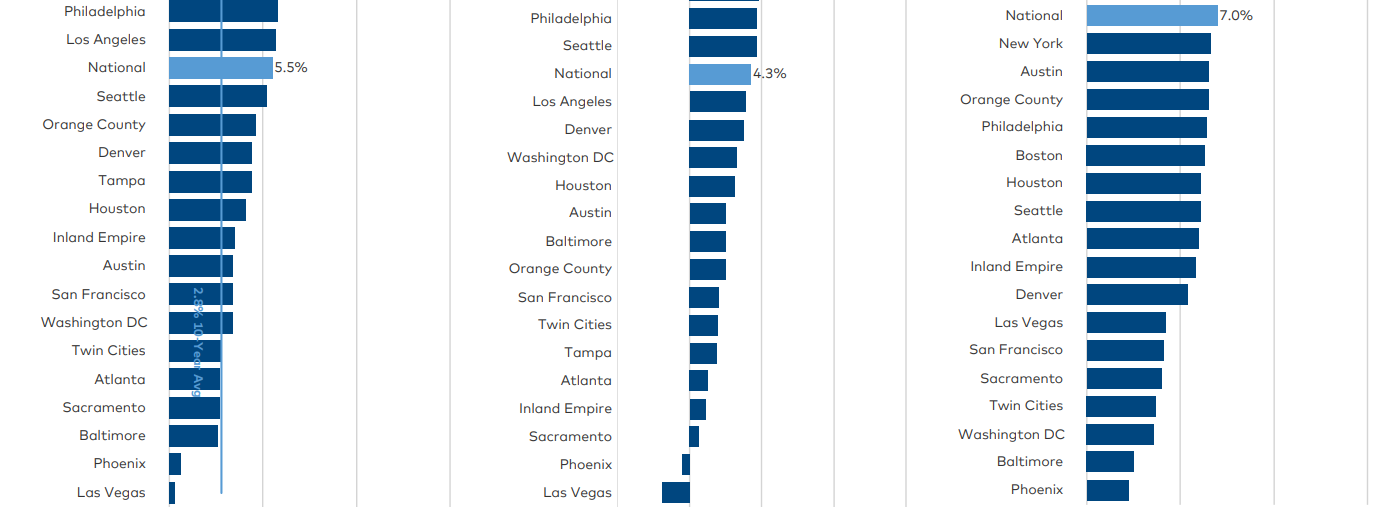
Yardi Matrix top markets:
They don’t have specific numbers for these, but there’s a bar graph that gives you a general idea of the year-over-year rent growth if you were to read the report.
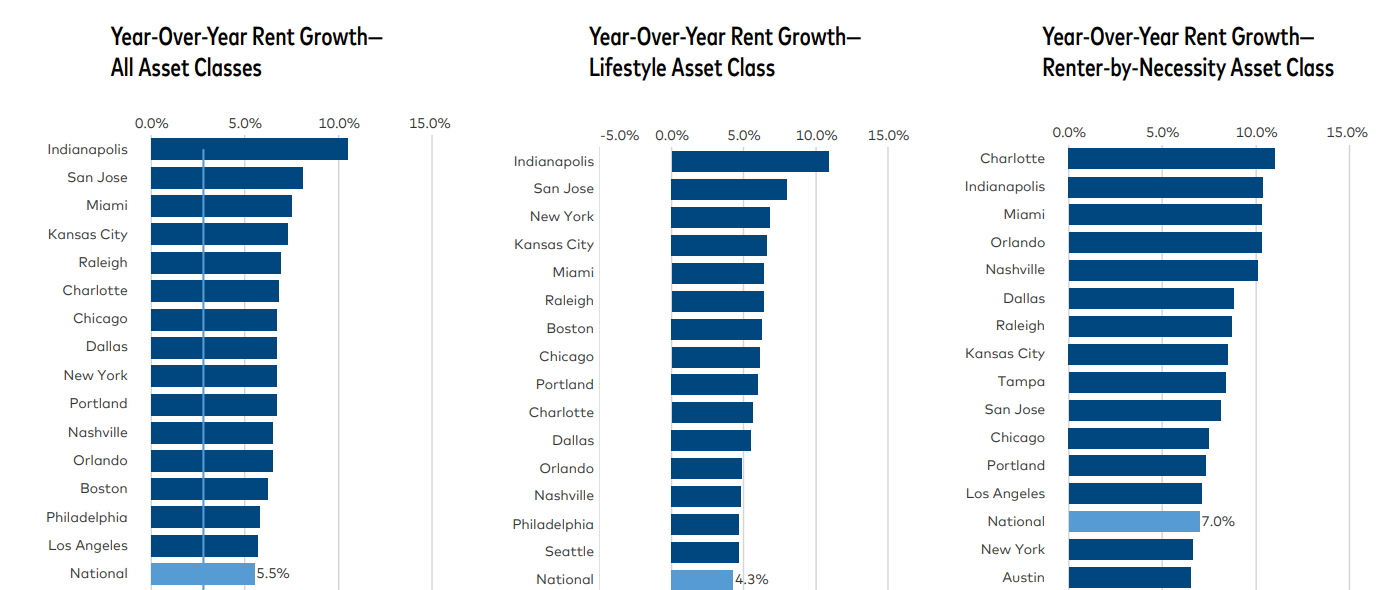
Indianapolis is at over 10% rent growth, then there’s a fall off with San Jose around 8%, followed by Miami maybe a little under 8%, and the rest are clustered around 7.5% YoY rent growth: Kansas City, Raleigh, Charlotte, and Chicago.
The lows of this list is Las Vegas with maybe .5% YoY rent growth, then Phoenix, then a big jump to 2.5% rent growth for Baltimore, Sacramento, Atlanta, and the Twin Cities.
Really a decent amount of agreement between Redfin and Yardi Matrix, but the amplitude is way stronger for the Redfin data. Is that the right word to use there? Amplitude? Bigger swings.
Staying with Yardi Matrix, their summary of relevant economic conditions references the recent strong jobs report such that, even considering the possibility of higher interest rates, “early data indicates solid evidence for a multifamily soft landing in 2023.”
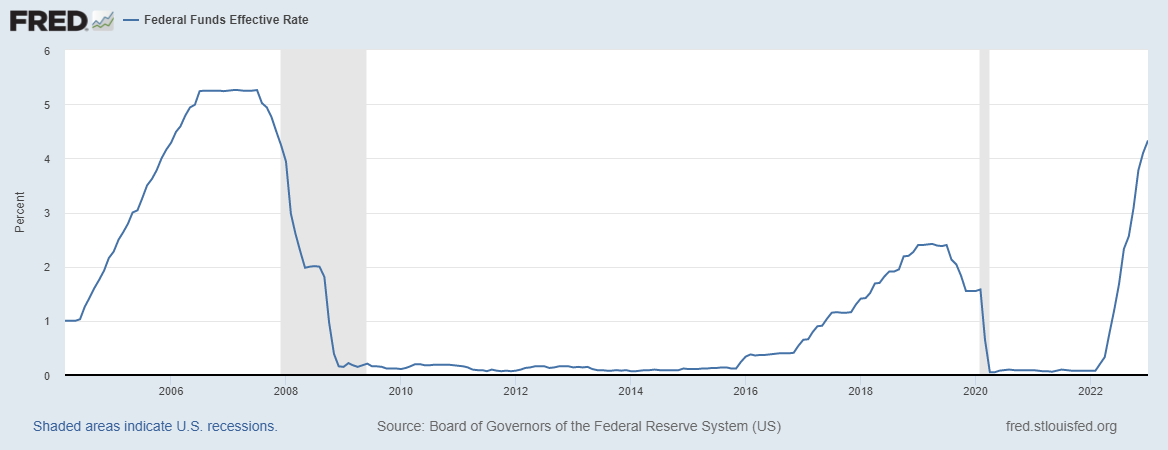
From April 2008 to August 2022, the Federal Funds rate was below 2.5%, a little over 14 years. The last time the Fed raised interest rates above 5%, it kept them there for a year, from July 2006 to August 2007. I don’t think that we’ve seen the full impact of higher interest rates on the investment side, but as far as multifamily fundamentals goes, I’d agree with Yardi and point to all of the positive economic signals we are getting.
Back to multifamily, Yardi’s numbers for renewal rent growth are decelerating, but, as they say they “remain strong.” This is a valid point, but I think that the trend of decelerating renewal rent growth is going to get worse before it gets better. Right now, we’re just about a year out from peak rent growth, which, you renew every year, the next year rolls around, that renewal rent is going to reflect some of that growth. Going forward, renewals will reflect smaller (but still elevated) rent growth as we move farther from the record-breaking YoY rent growth of early 2022.
